6.3. Жишээ: Төмөрбулаг сумын загварчлалын тооцоо
Энд бид Бархасбадь гаригт симуляцийн тооцоог хэрхэн гүйцэтгэхийг харуулахын тулд Төмөрбулаг сумын тооцоог жишээ болгон авч үзье.
6.3.1. Мэдээлэл бэлтгэх, тооцоолох
import pysd
import numpy as np
import pandas as pd
import re
from pathlib import Path
import matplotlib.pyplot as plt

import warnings
warnings.filterwarnings('ignore')
Гурван хувилбарын симуляцийн параметрийг тодорхойлох.
keys = ['Forage production','Carrying capacity','Livestock','Livestock output','Livestock output rate']
Олон хувилбарт загварчлалын тооцоолол хийх функцуудыг тодорхойлох.
def calculate(project_path):

    historical_livestock = pd.read_excel( project_path / 'input_data.xlsx',
                                         'historical_livestock').iloc[1][2:].values.astype('float')
    for scenario in [126,245,585]:
        fn = project_path / 'models' / f'{scenario}.py'
        strings = open(fn).read()
        modified_string = re.sub(r',\n    lambda: (\d+)', r',\n    lambda: '+str(int(historical_livestock[0])), strings)
        open(fn,'w',encoding='utf-8').write(modified_string)

    x = np.log(np.arange(1,historical_livestock.shape[0]+1))
    BAUk,BAUb = np.polyfit(x,historical_livestock,1)
    x = np.arange(36)

    BAU_values = BAUk*np.log(x)+BAUb

    all_results = []
    for scenario in [126,245,585]:
        model = pysd.load( project_path / 'models' / f'{scenario}.py' )
        all_results.append(model.run()[keys])
    for key in keys:
        all_results[0][key].iloc[7] = all_results[1].iloc[7][key]
        all_results[1][key].iloc[7] = all_results[1].iloc[7][key]
        all_results[2][key].iloc[7] = all_results[1].iloc[7][key]

    all_results[0]['Livestock'].iloc[7] = historical_livestock[-1] # 126
    all_results[1]['Livestock'].iloc[7] = historical_livestock[-1] # 245
    all_results[2]['Livestock'].iloc[7] = historical_livestock[-1] # 585

    return all_results,BAU_values
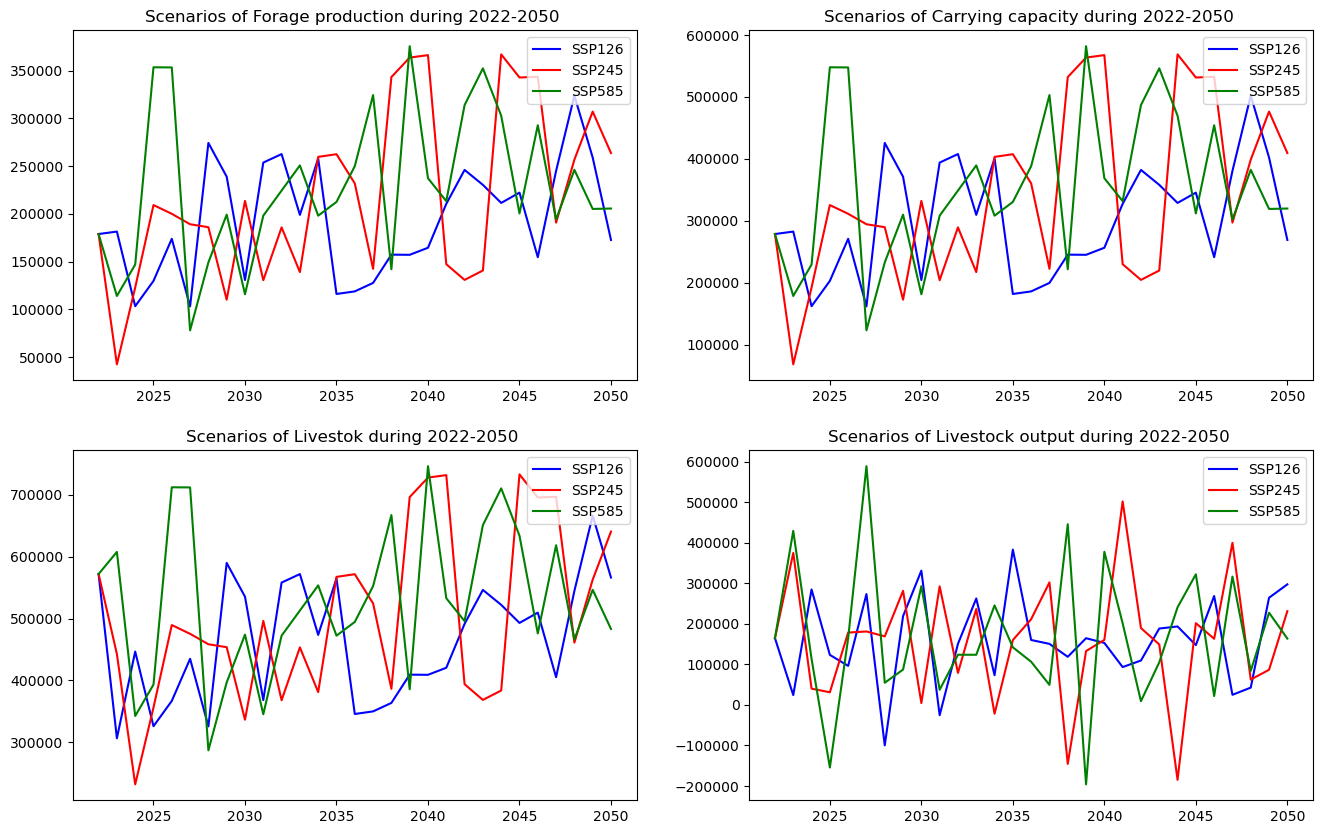
6.3.2. Мал аж ахуйн тогтолцооны хувилбарууд 2022-2050
project_path = Path('Tumurbulag')
all_results,  BAU_values = calculate(project_path)
results = [i[7:] for i in all_results]
Симуляцийн өгөгдлийг зурах функцийг тодорхойлох.
def show_results(results):
    colors = ['blue','red','green']
    plt.figure(figsize=(16,10))
    plt.subplot(2,2,1)
    for i in range(3):
        plt.plot(np.arange(2022,2051),results[i]['Forage production'].values,colors[i])
        plt.legend(['SSP126','SSP245','SSP585'],loc='upper right')
    plt.title('Scenarios of Forage production during 2022-2050 ')

    plt.subplot(2,2,2)
    for i in range(3):
        plt.plot(np.arange(2022,2051),results[i]['Carrying capacity'].values,colors[i])
        plt.legend(['SSP126','SSP245','SSP585'],loc='upper right')
    plt.title('Scenarios of Carrying capacity during 2022-2050 ')

    plt.subplot(2,2,3)
    for i in range(3):
        plt.plot(np.arange(2022,2051),results[i]['Livestock'].values,colors[i])
        plt.legend(['SSP126','SSP245','SSP585'],loc='upper right')
    plt.title('Scenarios of Livestok during 2022-2050 ')

    plt.subplot(2,2,4)
    for i in range(3):
        plt.plot(np.arange(2022,2051),results[i]['Livestock output'].values,colors[i])
        plt.legend(['SSP126','SSP245','SSP585'],loc='upper right')
    plt.title('Scenarios of Livestock output during 2022-2050 ')
show_results(results)
Хяналтын параметрүүдийг тооцоолох функцийг тодорхойлно.
def scen(results):
    means = []
    stds = []
    MV = []
    SV = []
    for key in keys:
        mean_ = np.array([re[key].mean() for re in results])
        MV.extend(mean_)
        std_ = np.array([re[key].std() for re in results])
        SV.extend(std_)
        means.append((mean_==(mean_.max()))+(mean_==(mean_.min()))*-1)
        stds.append((std_==(std_.min()))+(std_==(std_.max()))*-1)
    MV.extend([np.nan]*3)
    SV.extend([np.nan]*3)

    index = pd.MultiIndex.from_product(
        [["Forage production/ton", "Carrying capacity/SU","Livestock/SU","Livestock output/SU","Livestock output rate/SU","Sustainability scores"],
         ["SSP126", "SSP245", "SSP585"]],
        names=["Variable", "Scenarios"]
    )

    columns = ["MV", "SV", "MV'", "SV'", "TV_j"]

    MV_ = np.concatenate([np.array(means).flatten(),np.array(means).sum(axis=0)])
    SV_ =np.concatenate([np.array(stds).flatten(),np.array(stds).sum(axis=0)])
    TV = MV_+SV_
    data = np.concatenate([[MV],[SV],[MV_],[SV_],[TV]])
    Sus_df = pd.DataFrame(data.T, index=index, columns=columns)
    return Sus_df, means, stds
Тооцооллыг хийж, үр дүнг харна уу:
Sus_df,means, stds = scen(results)
Sus_df
Функцийг тодорхойлж, хяналтын үр дүнг тооцоолох:
def show_text():

    TV = np.array(means).sum(axis=0)+np.array(stds).sum(axis=0)
    if TV[1]>=2:
        SSP_index=1
    else:
        SSP_index = np.argmax(TV)
    Best_Scenario = 'SSP'+str([126,245,585][SSP_index])

    text = f"""Best Scenario is {Best_Scenario}.
    Over the next three decades, forage production, carrying capacity, livestock numbers and livestock output fluctuate and remain stable.
    Among the three scenarios (SSP126, SSP245 and SSP585),the {Best_Scenario} scenario for {project_path.name} in the lower reaches of the basin,
    was identified as the rational scenario for the highest productivity and stability.
    """
    print(text)
    return SSP_index, Best_Scenario
Дээрх функцийг ажиллуулна уу:
SSP_index, Best_Scenario = show_text()
Best Scenario is SSP126.
    Over the next three decades, forage production, carrying capacity, livestock numbers and livestock output fluctuate and remain stable.
    Among the three scenarios (SSP126, SSP245 and SSP585),the SSP126 scenario for Tumurbulag in the lower reaches of the basin,
    was identified as the rational scenario for the highest productivity and stability.
6.3.3. Түүхэн болон урьдчилан тооцоолсон хугацааны хоорондох бараа материалын ханшийн өөрчлөлт
Өөрчлөлтийг тооцоолох функцийг тодорхойлох:
def change():
    historical_data = pd.read_excel(project_path / 'input_data.xlsx','grassland_area').iloc()[SSP_index+1][2:9]
    grass_land_area = np.nanmean(historical_data.values)

    Carrying_capacity_Scenario = Sus_df['MV']['Carrying capacity/SU'][SSP_index]
    Forage_production_Scenario = Sus_df['MV']['Forage production/ton'][SSP_index]
    Livestock_Scenario = Sus_df['MV']['Livestock/SU'][SSP_index]
    Livestock_output_Scenario = Sus_df['MV']['Livestock output/SU'][SSP_index]

    Forage_production_before = all_results[SSP_index][:8]['Forage production'].mean()
    Carrying_capacity_before = all_results[SSP_index][:8]['Carrying capacity'].mean()
    Livestock_before = all_results[SSP_index][:8]['Livestock'].mean()
    Livestock_output_before = all_results[SSP_index][:8]['Livestock output'].mean()


    data = [[project_path.name,
             '2015-2022',
             '%d'%(Forage_production_before/grass_land_area*1000),
             '%d' %(Carrying_capacity_before),
             '%.2f'%(Carrying_capacity_before/grass_land_area),
             '%d'%(Livestock_before),'%.2f'%(Livestock_before/Carrying_capacity_before),
             '%d'%(Livestock_output_before)],
            ['',
             '2022-2050',
             '%d'%(Forage_production_Scenario/grass_land_area*1000),
             '%d' %(Carrying_capacity_Scenario),
             '%.2f'%(Carrying_capacity_Scenario/grass_land_area),
             '%d'%(Livestock_Scenario),
             '%.2f'%(Livestock_Scenario/Carrying_capacity_Scenario),
             '%d'%(Livestock_output_Scenario)]
           ]

    # Define indexes for multiple layers of columns
    columns = pd.MultiIndex.from_tuples([
        ('Soums', ''),
        ('Period', ''),
        ('Grassland', 'Forage (kg/ha)'),
        ('Grassland', 'Carrying capacity (SU)'),
        ('Grassland', 'Carrying capacity (SU/ha)'),
        ('Livestock', 'Livestock (SU)'),
        ('Livestock', 'Stocking rate'),
        ('Livestock', 'Livestock output (SU)')
    ])
    change_df = pd.DataFrame(data, columns=columns)

    num1 = (Forage_production_Scenario-Forage_production_before)*100/Forage_production_before
    num2 = Carrying_capacity_before/grass_land_area
    num3 = Carrying_capacity_Scenario/grass_land_area
    num4 = Livestock_before/Carrying_capacity_before
    num5 = Livestock_Scenario/Carrying_capacity_Scenario
    text = f'''The projected average forage yield in {project_path.name} is expected to {'increase' if num1 > 0 else'decrease'} by {'%.2f'%(abs(num1))}%,
    compared to the historical period.
    The carrying capacity is projected to {'decrease' if num2<num3 else 'increase'} from {'%.2f'%num2} SU/ha during 2015-2022 to {'%.2f'%num3} SU/ha during 2022-2050.
    The stocking rate is projected to {'decrease' if num4<num5 else 'increase'} from {'%.2f'%num4} during 2015-2022 to {'%.2f'%num5} during 2022-2050.'''
    print(text)
    return change_df
Функцийг ажиллуулаад үр дүнг гарга:
change_df = change()
The projected average forage yield in Tumurbulag is expected to increase by 0.67%,
    compared to the historical period.
    The carrying capacity is projected to decrease from 1.19 SU/ha during 2015-2022 to 1.21 SU/ha during 2022-2050.
    The stocking rate is projected to decrease from 1.46 during 2015-2022 to 1.55 during 2022-2050.
change_df
6.3.4. Малын системийн регрессийн симуляци
Сценари загварчлалын үр дүнд тулгуурлан стратегийн зөвлөмжийг тооцоолох функцуудыг тодорхойлох.
def strategy():
    BAU = BAU_values[8:].mean()
    Cp = results[SSP_index].mean()['Carrying capacity']
    stock_rate_BAU = BAU/Cp
    SSP_RCP_Scenarios = results[SSP_index].mean()['Livestock']
    Stock_rate_Scenario = SSP_RCP_Scenarios/Cp
    BAU_RCP_Reduction = BAU-SSP_RCP_Scenarios
    reduction_rate_0 = BAU_RCP_Reduction/BAU
    RCP_Cp_Reduction = SSP_RCP_Scenarios-Cp
    reduction_rate_1 = RCP_Cp_Reduction/SSP_RCP_Scenarios

    columns = "Livestock    BAU     SSP-RCP Scenarios       Carrying capacity       Reduction from BAU to rational scenarios        Reduction rate from BAU to rational scenarios   Reduction from scenarios to Carrying capacity   Reduction rate from scenarios to Carrying capacity ".split('\t')
    data = [project_path.name,BAU,SSP_RCP_Scenarios,Cp,BAU_RCP_Reduction,reduction_rate_0,RCP_Cp_Reduction,reduction_rate_1]
    strategy_df = pd.DataFrame(np.array([data]), columns=columns)
    text = f"""In the coming three decades, {project_path.name} will be heavily overloaded under the BAU scenario,
    and even under the rational SSP scenarios.
    To maintain forage-livestock equilibrium,livestock should be reduced in the two consecutive steps:
    1) First Step:reducing livestock from BAU torational future scenarios by {'%d' %BAU_RCP_Reduction} SU ({'%.2f' %(reduction_rate_0*100)}% reduction).
    2) SecondStep: reducing livestock from rational scenarios to carrying capacity {'%d' %RCP_Cp_Reduction} SU ({'%.2f' %(reduction_rate_1*100)}% reduction)."""
    print(text)

    return strategy_df
Функцийг ажиллуулаад үр дүнг харна уу:
strategy_df = strategy()
strategy_df
In the coming three decades, Tumurbulag will be heavily overloaded under the BAU scenario,
    and even under the rational SSP scenarios.
    To maintain forage-livestock equilibrium,livestock should be reduced in the two consecutive steps:
    1) First Step:reducing livestock from BAU torational future scenarios by 171060 SU (26.89% reduction).
    2) SecondStep: reducing livestock from rational scenarios to carrying capacity 164164 SU (35.31% reduction).
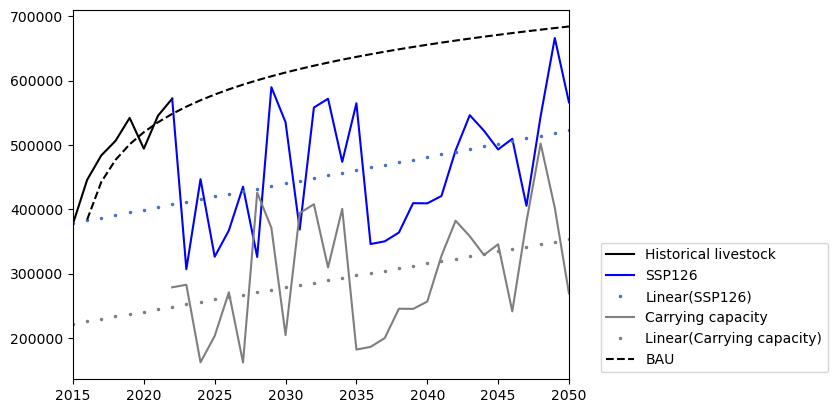
Функцийг тодорхойлж, тохирох ба графикийг зурна уу:
def plot_fit():
    historical_livestock = pd.read_excel( project_path / 'input_data.xlsx',
                                         'historical_livestock').iloc[1][2:].values.astype('float')
    plt.plot(np.arange(2015,2023),historical_livestock,color='black')
    plt.plot(np.arange(2022,2051),results[SSP_index]['Livestock'].values,color='#0000FF')
    x,y = [np.arange(2022,2051),results[SSP_index]['Livestock'].values]
    k,b = np.polyfit(x,y,1)

    print(k,b)

    plt.plot(np.arange(2015,2051),k*np.arange(2015,2051)+b,'.',color='#4472C4',markersize=3)
    x,y = [np.arange(2022,2051),results[SSP_index]['Carrying capacity'].values]
    k,b = np.polyfit(x,y,1)
    print(k,b)

    plt.plot(x,y,color='#7F7F7F')
    plt.plot(np.arange(2015,2051),k*np.arange(2015,2051)+b,'.',color='#7F7F7F',markersize=3)
    plt.plot(np.arange(2015,2051),BAU_values,'--',c='black')
    plt.xlim(2015,2050)
    plt.legend(['Historical livestock',Best_Scenario,f'Linear({Best_Scenario})','Carrying capacity','Linear(Carrying capacity)','BAU'],
               bbox_to_anchor=(1.05,0),
               loc='lower left')
Энэ функцийг ажиллуулна уу:
plot_fit()
4104.998173025084 -7892787.658744299
3737.161682109544 -7308037.384229856